Resource Tracker
Live appSee who is billable, who is on the bench, and where every project stands
A capacity-planning and project-health application for a consulting practice. It brings resource allocation, timesheet actuals, project financials, and utilization reporting into one place, and layers a live Jira feed on top for project-health dashboards. What each person sees is driven by their role — a standard consultant sees only their own workspace, while practice leads and project managers get the analytics and administration screens.
Oracle APEX · PL/SQL · Oracle Autonomous Database · Chart.js · Jira REST
Open the app ↗The problem it solves
A services business runs on two questions it can rarely answer quickly: who is actually billable next week, and is each project on track against its budget? The answers usually live in scattered spreadsheets, a timesheet system, and a project tool that do not talk to each other.
How it works
- 1
Sign in with one of the demo logins below. What you can see depends on the role attached to that login — a standard user lands on a personal workspace, while a practice lead or PM sees the full navigation.
- 2
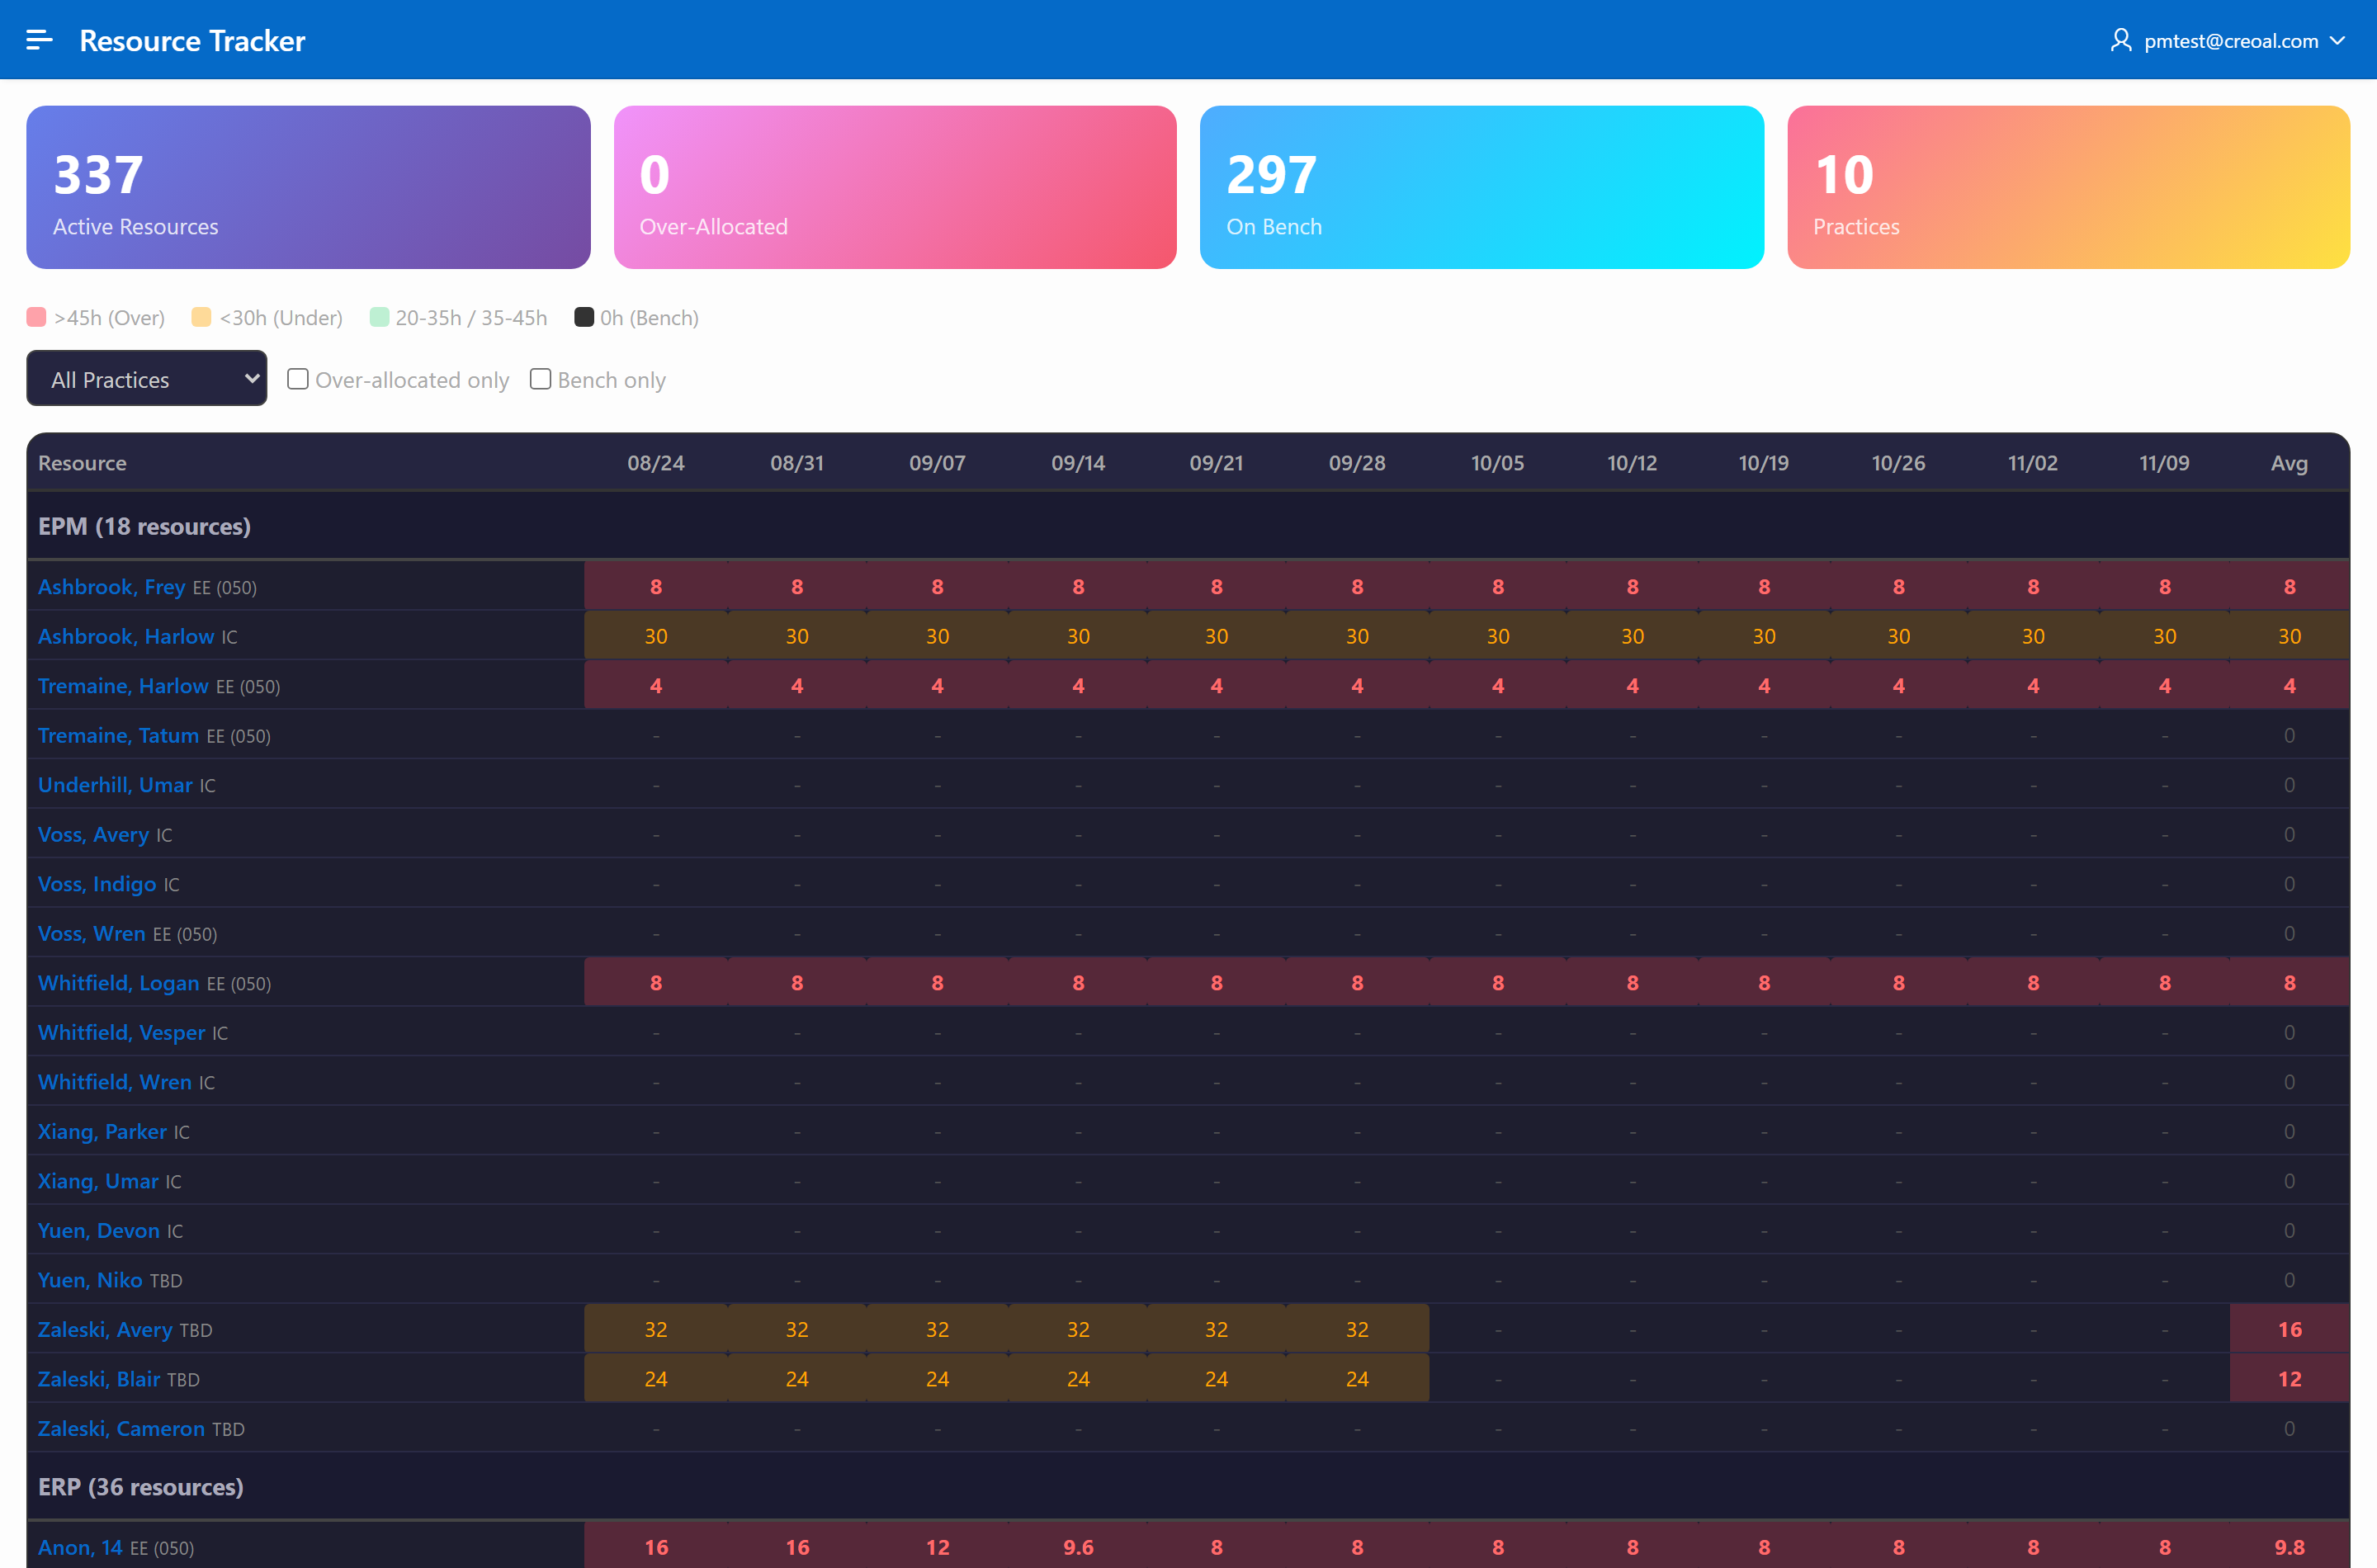
The allocation grid shows every resource across a rolling 26-week window, colour-banded from on the bench to over-allocated, so a lead can rebalance work at a glance. The cards up top count active resources, who is over-allocated, and who is on the bench.
- 3
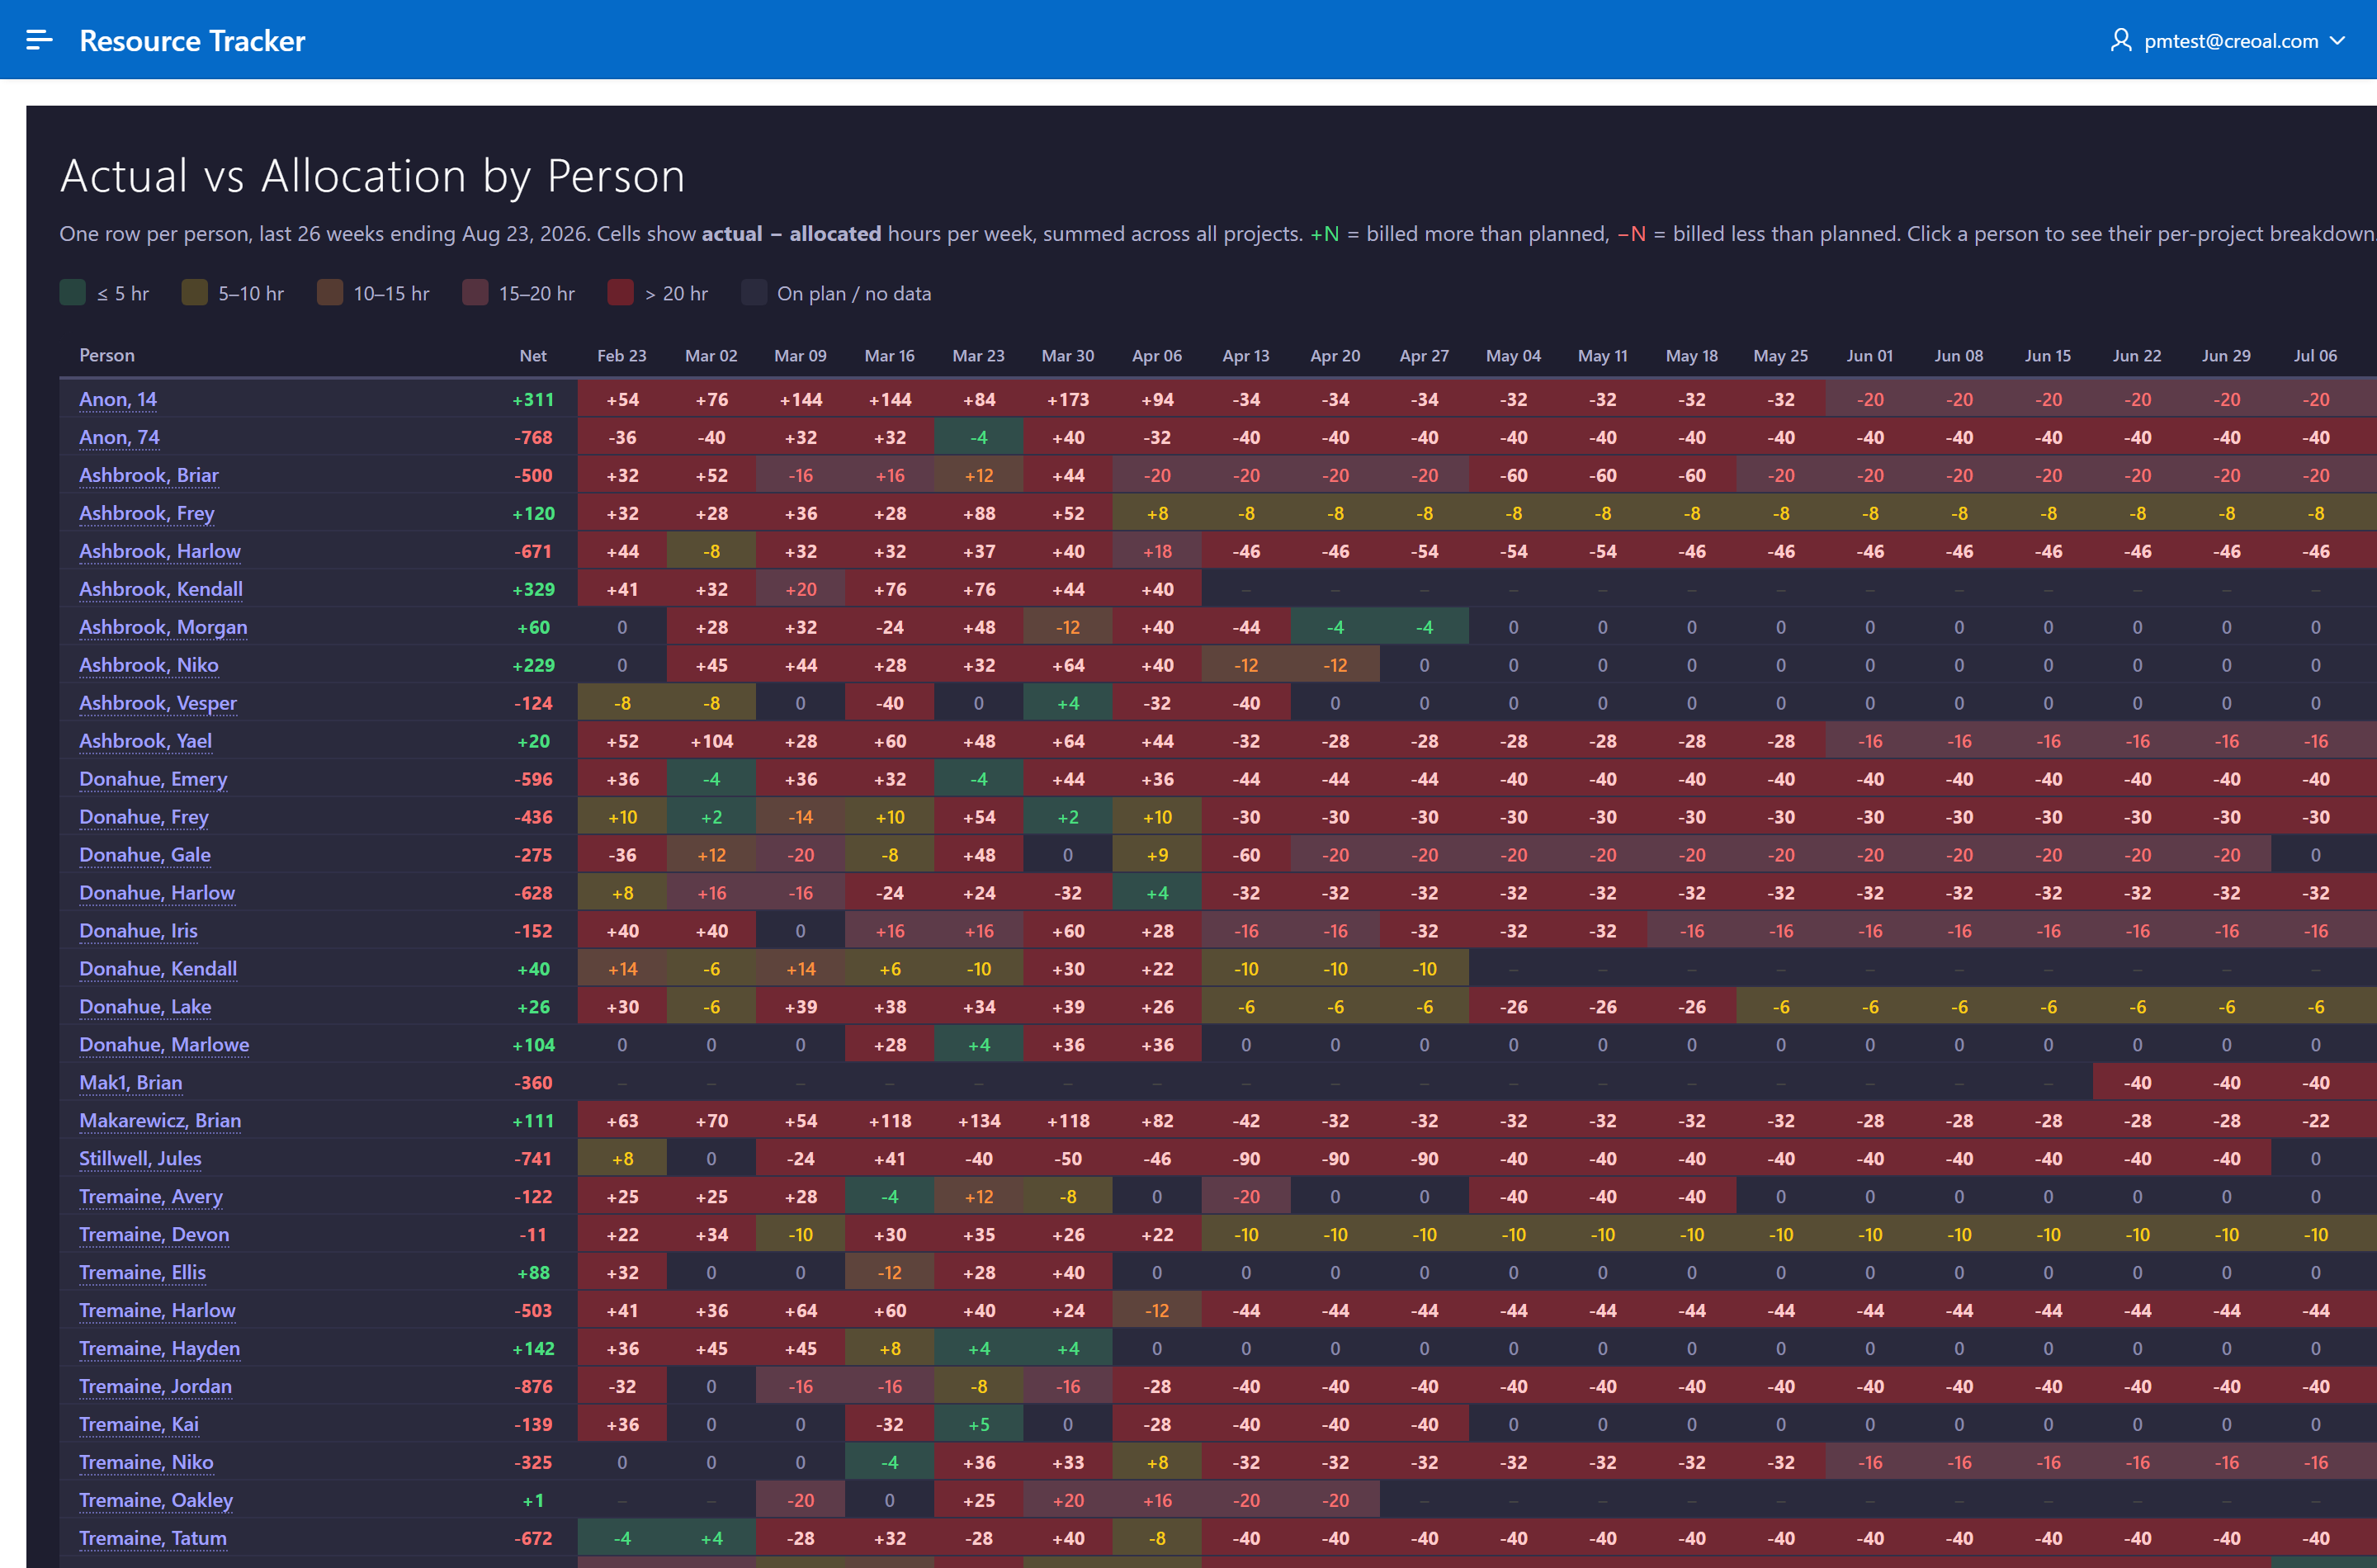
The variance view compares billed actuals against the plan for every person, week by week, and drills through to a per-project breakdown. Green means close to plan; red means a large gap in either direction.
- 4
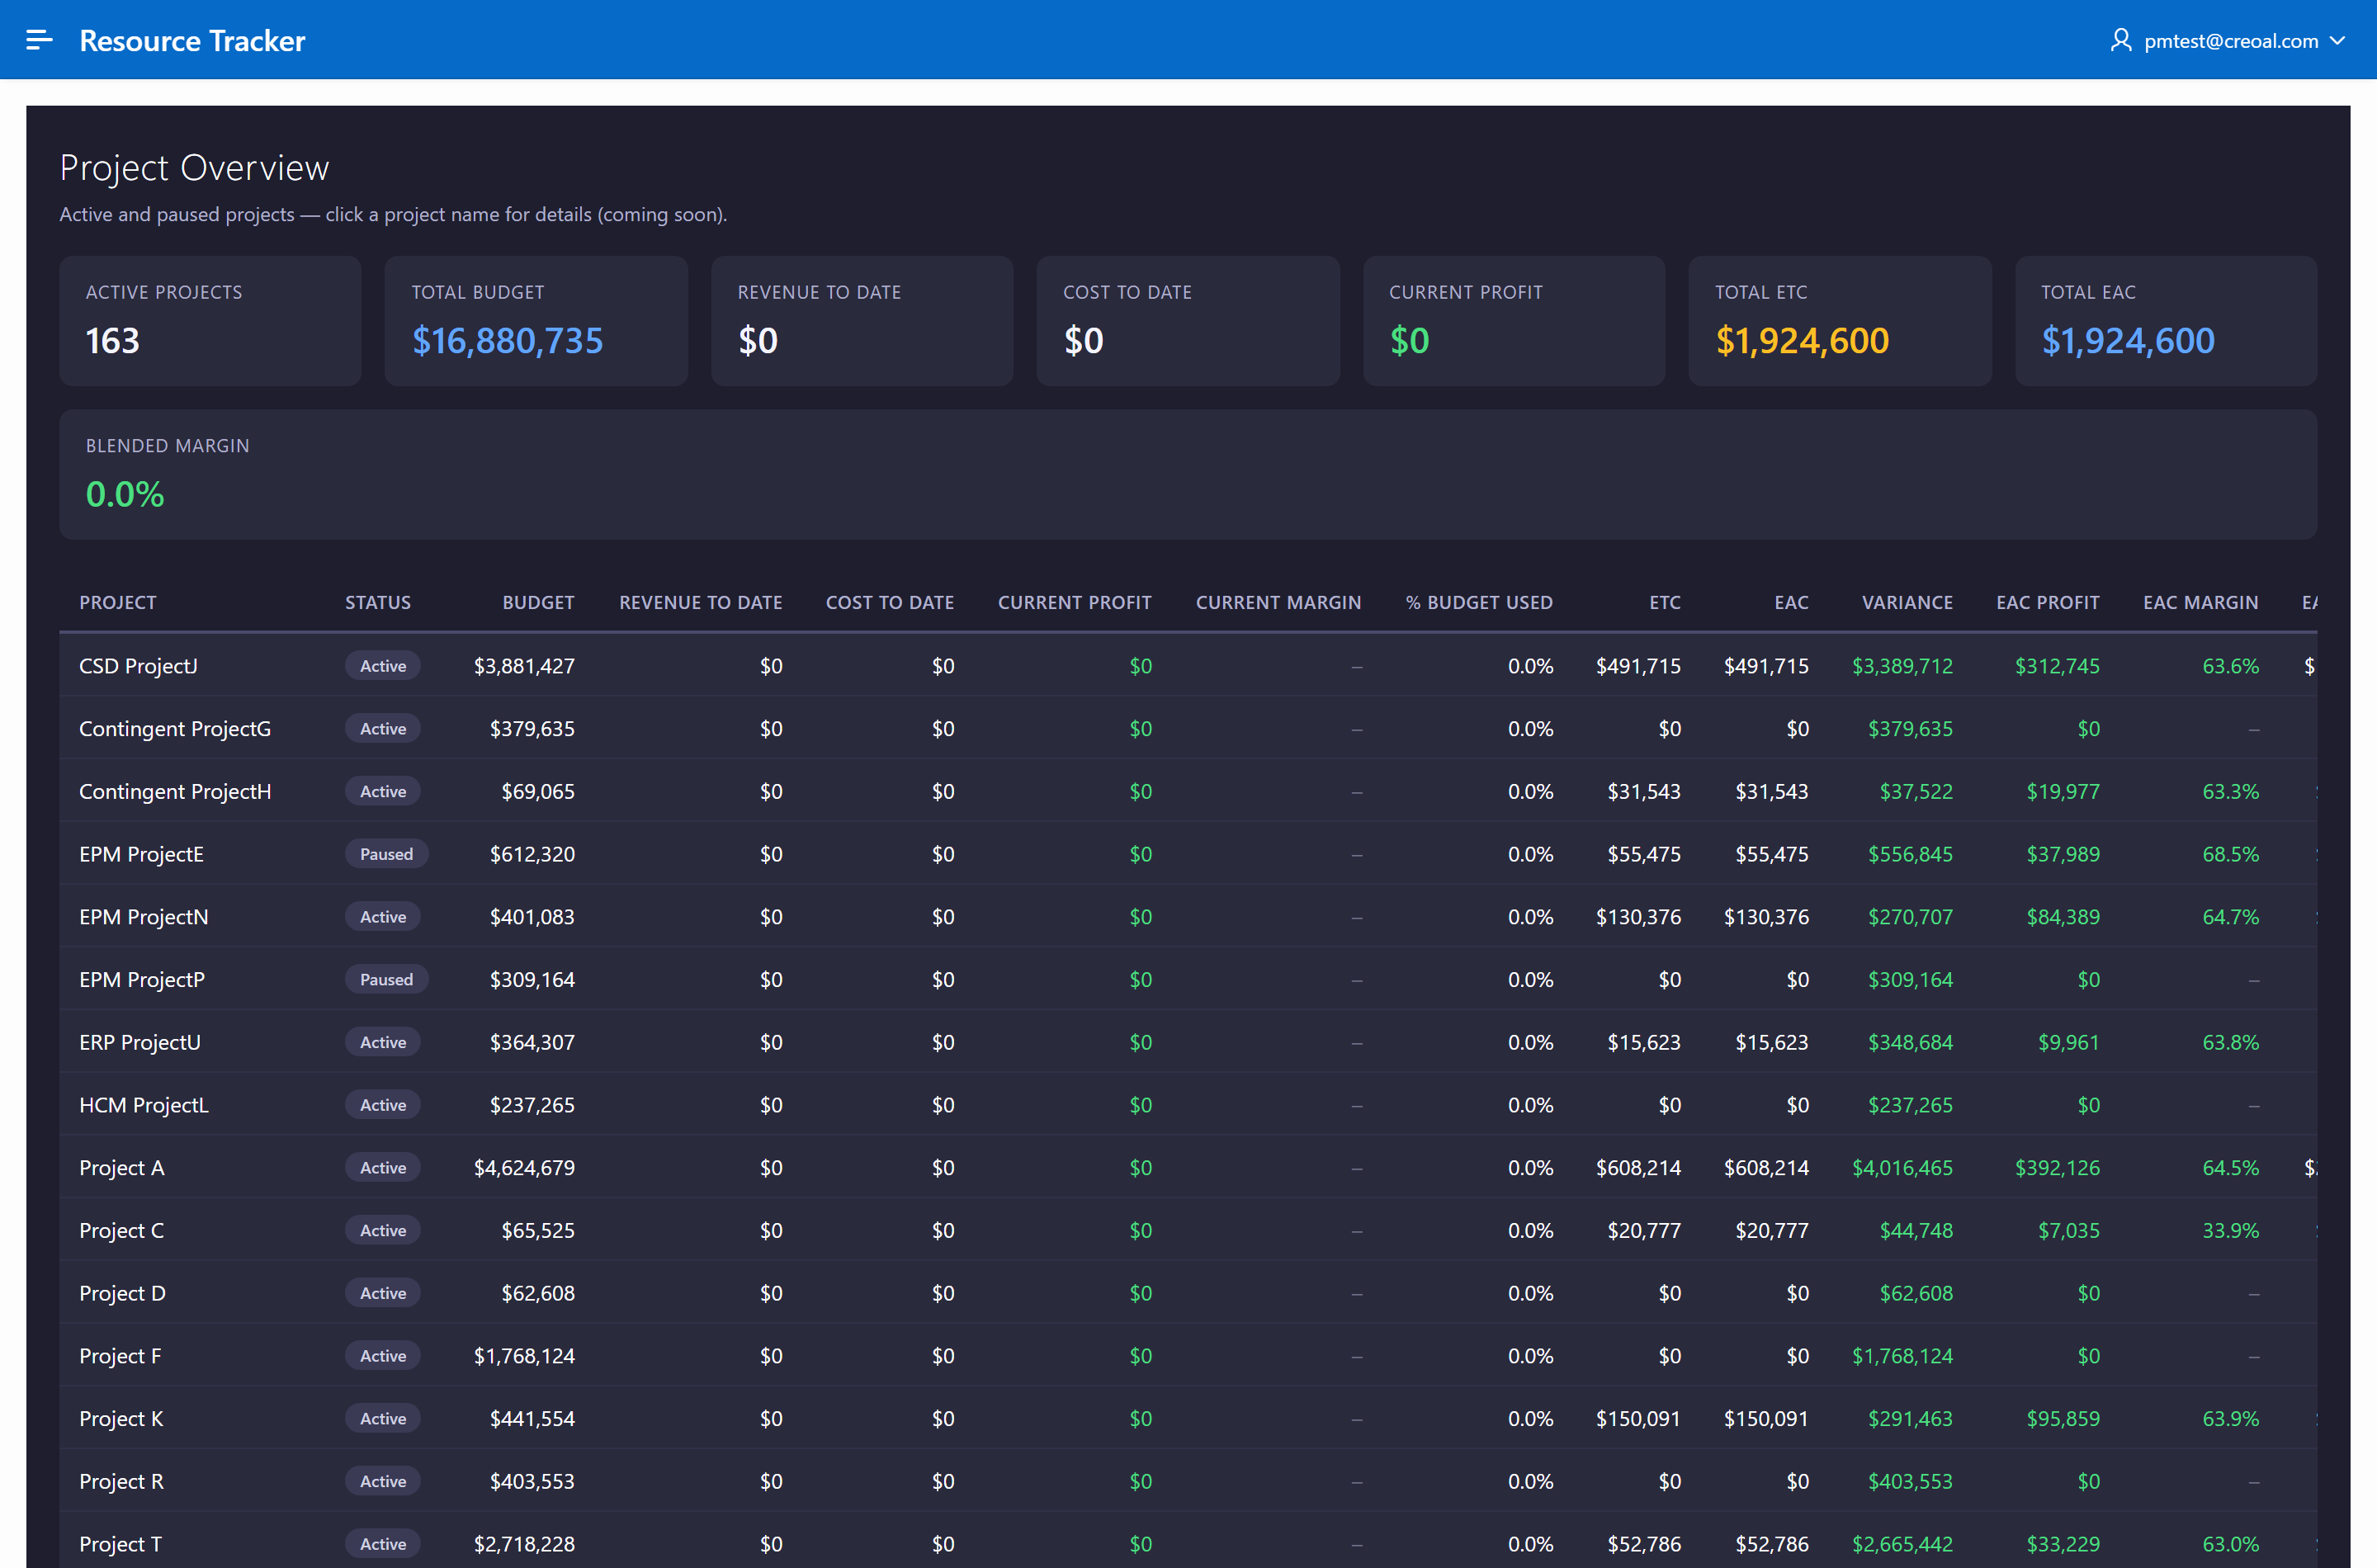
Project overview reports budget, estimate-to-complete, and margin for every active and paused project, each with a health flag.
Why it's useful
- →One rolling view of allocation and capacity — spot who is over-allocated, who is on the bench, and who is under-billing against their plan.
- →Actual-versus-allocated variance down to the individual person and project, with drill-through detail.
- →Project financials — budget, revenue and cost to date, estimate-to-complete, and margin — alongside a live Jira feed for project health.
- →Role-based access: standard users see only their own workspace; practice leads and PMs get analytics and admin screens.
Try it yourself
Sign in at the live demo with any of these logins to see how the app changes by role:
pmtest@creoal.comProject Manager — project financials, PM status reports, and the analytics screenspltest@creoal.comPractice Lead — allocation, capacity, and administration screens for their practiceusertest@creoal.comStandard user — a personal workspace showing only their own allocation and actuals
The resourcing, allocation, and financial data in the demo is synthetic and anonymized — no real people or rates. Passwords are available on request; they are not published here.
What data you will see
- →Weekly timesheet actuals from May 2025 through April 2026.
- →Resource assignments and allocation spanning 2022 through 2027.
- →337 resources across 10 practices and 167 projects.
- →A live daily sync of project issues from Jira.